Ecolibrium: Environmental Mapping Tool
2026 (current)
Product Design (UX/UI), Data Visualization, Public Interest Technology
About
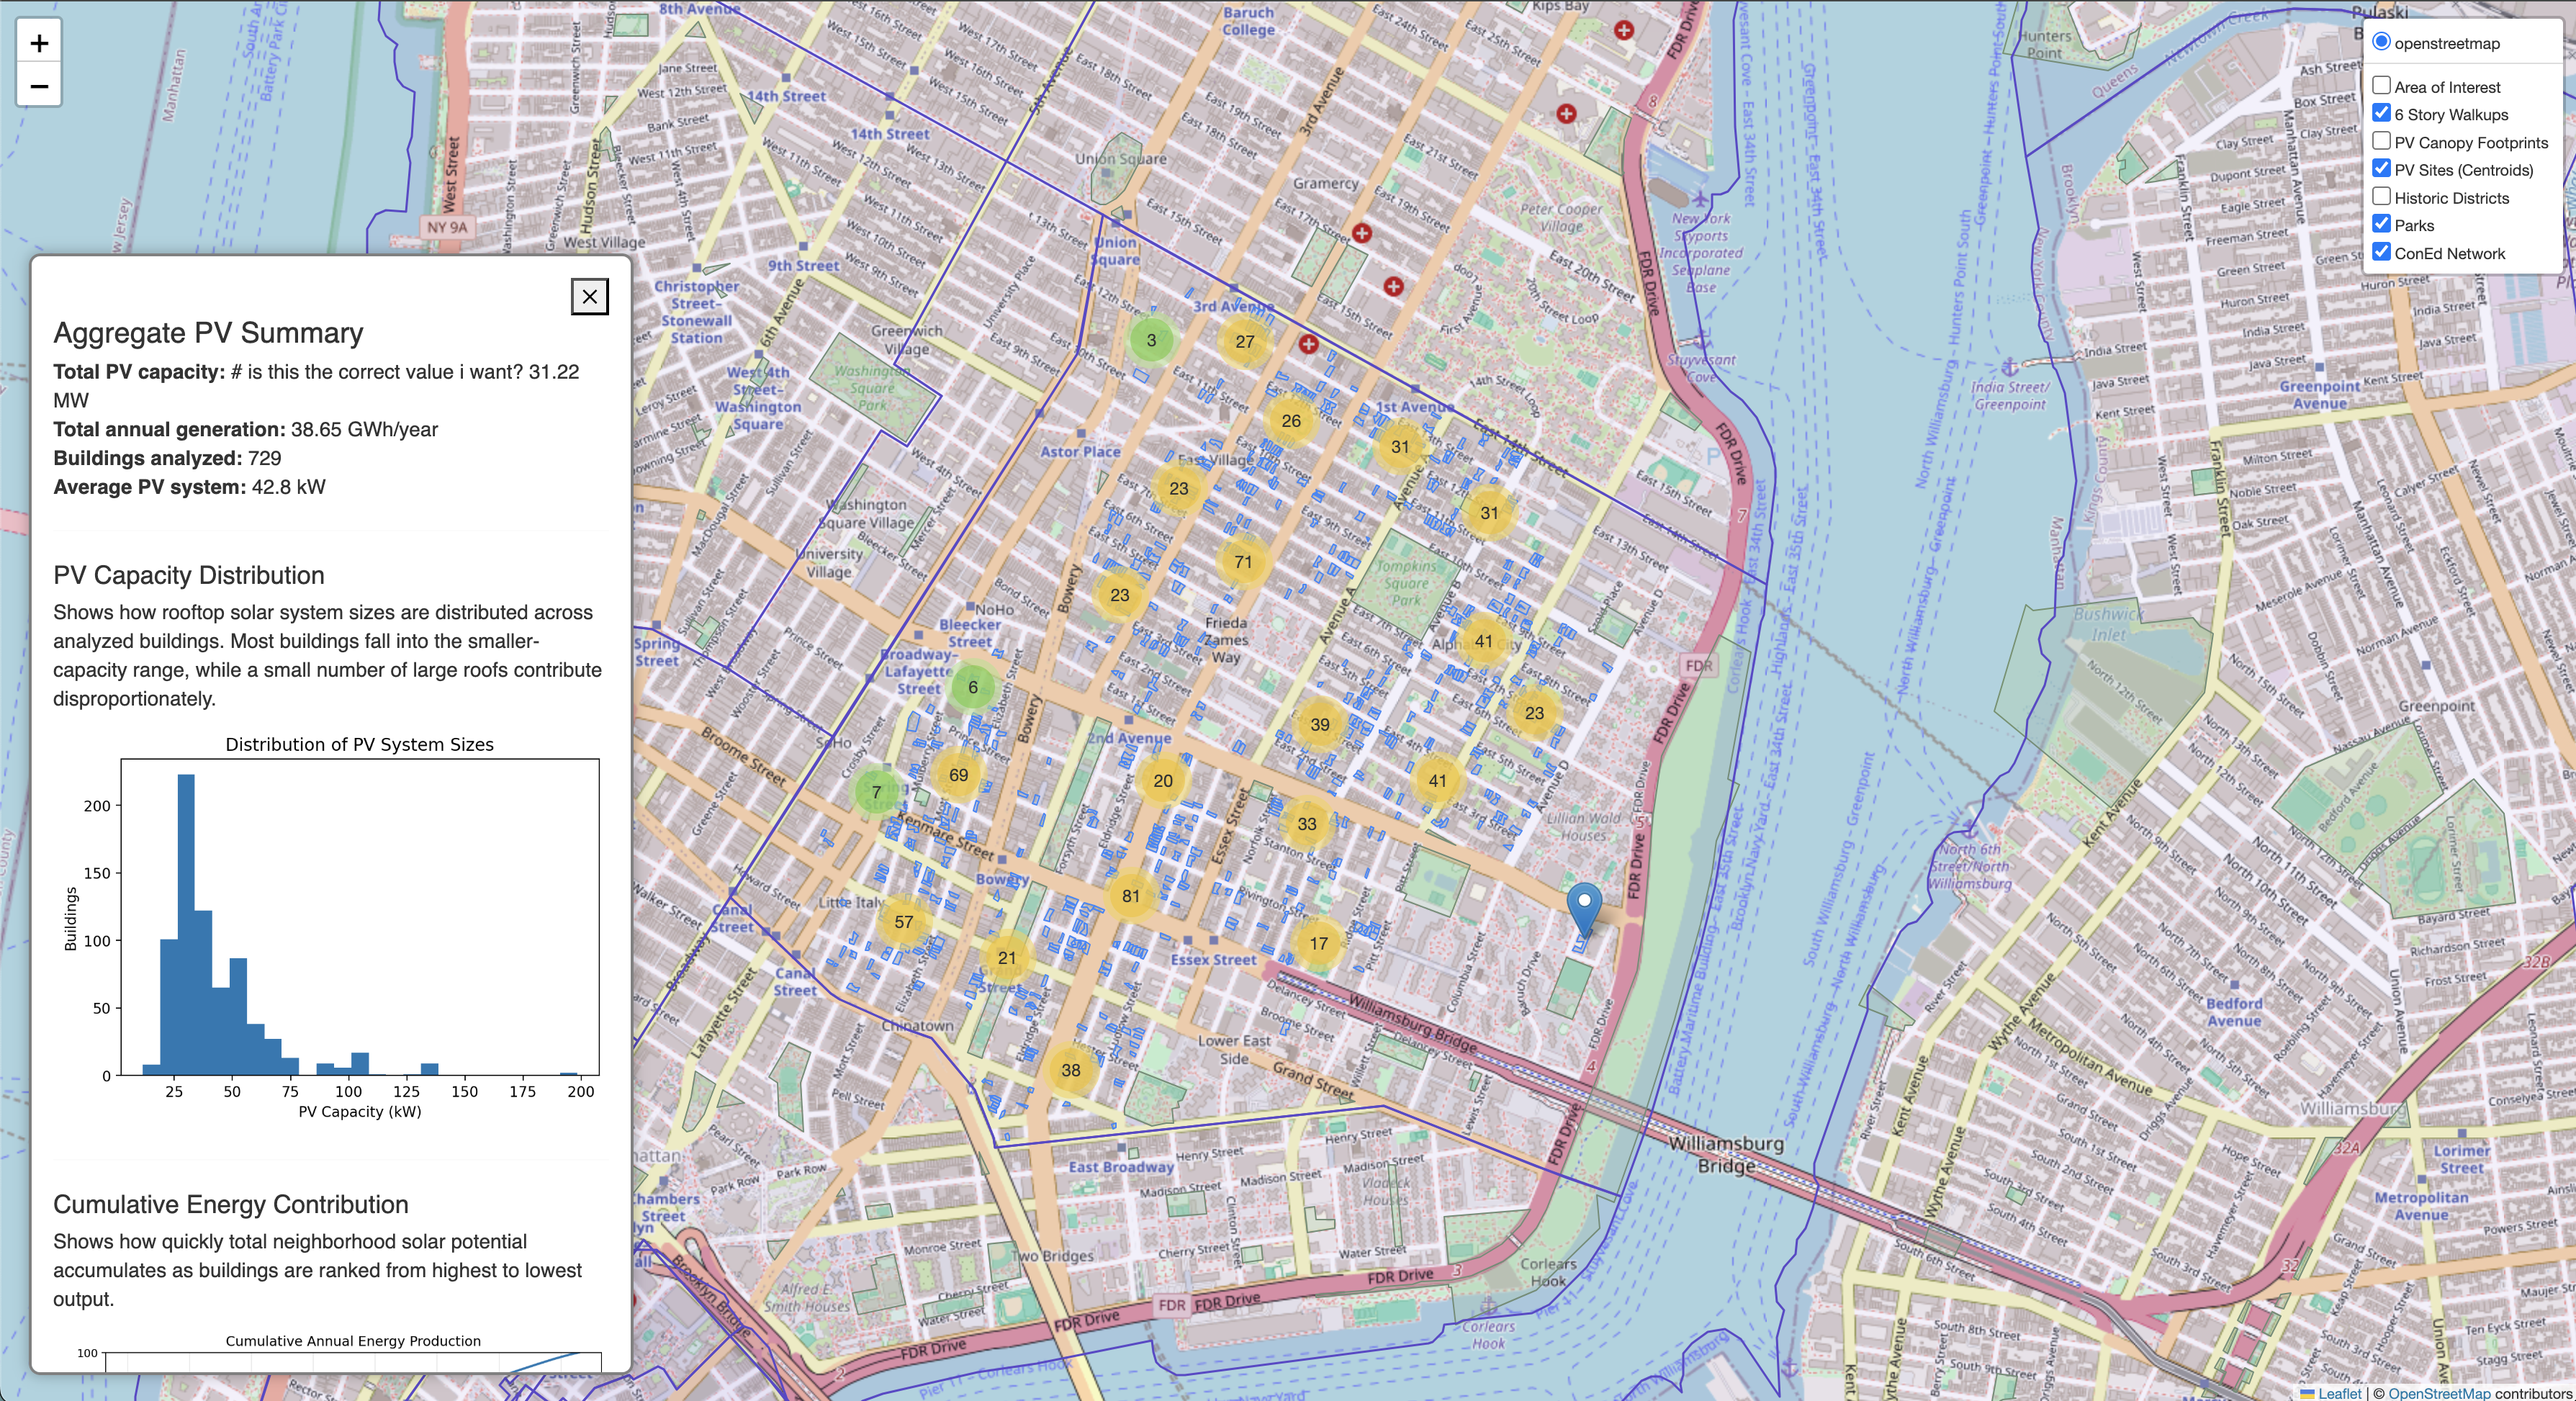
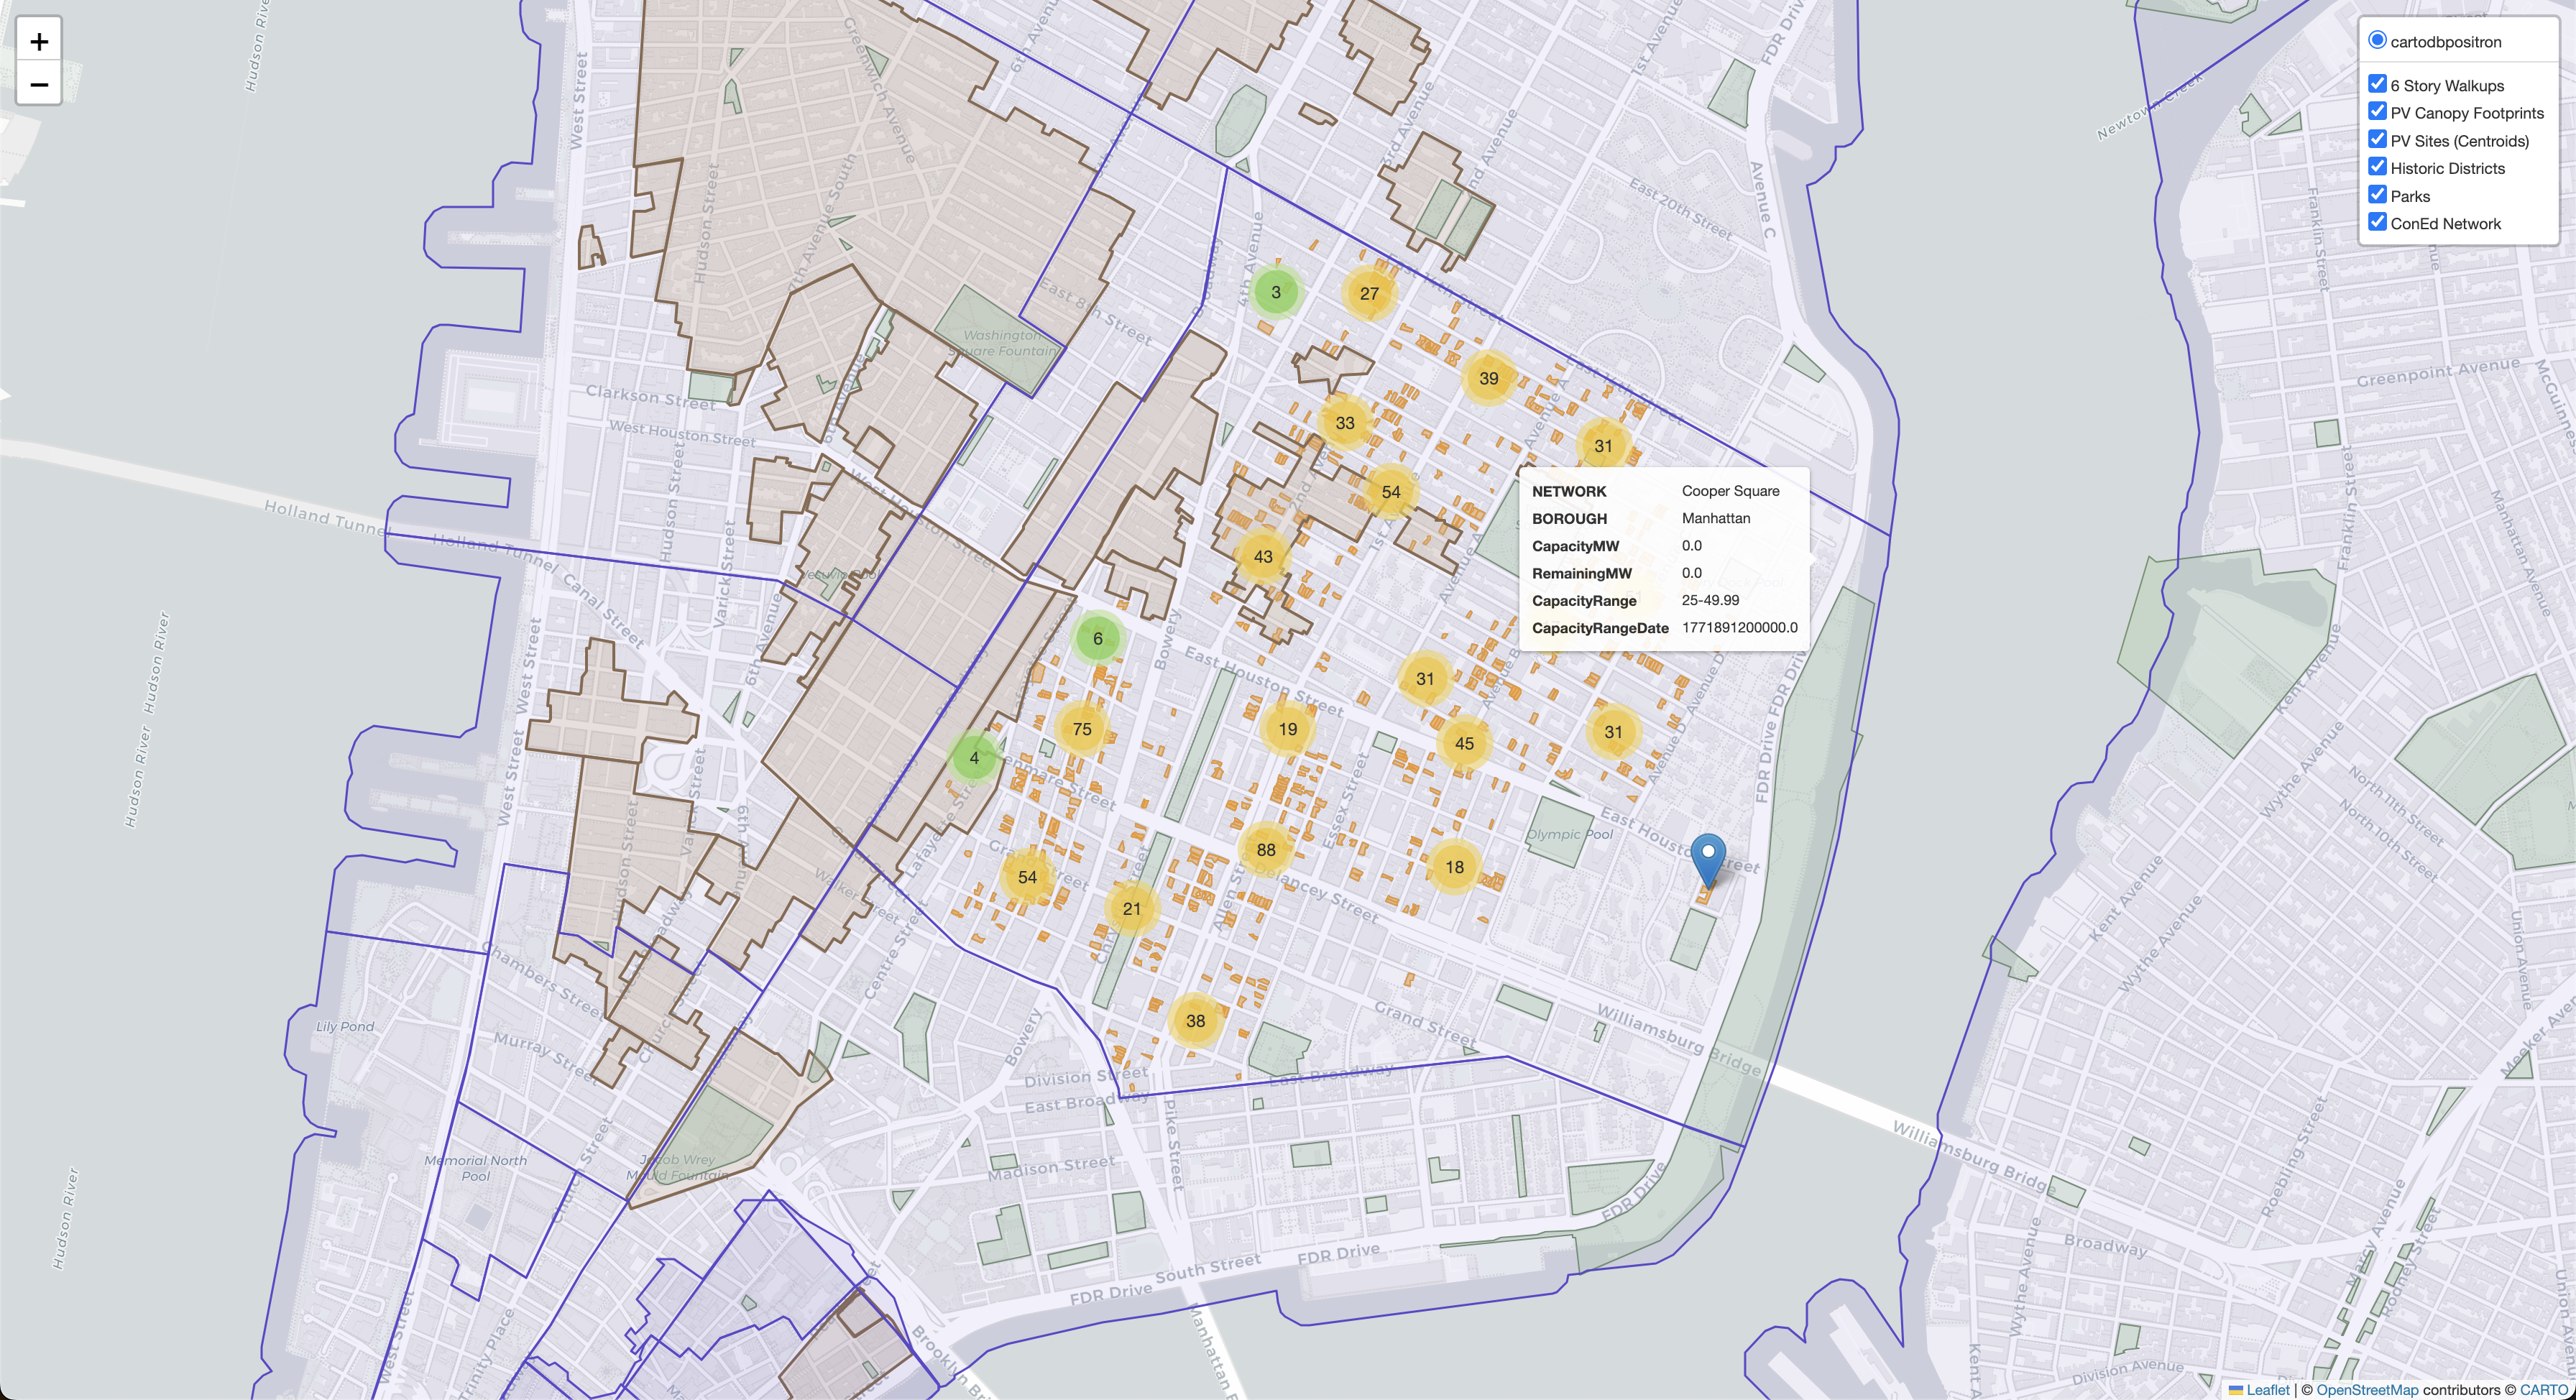
Ecolibrium is a climate literacy and environmental justice initiative at the Loisaida Center, researching how climate change materially affects New York's Lower East Side and East Village at a neighborhood scale. I'm designing and developing an interactive mapping tool that helps researchers study relationships between solar potential, energy usage, grid infrastructure, and environmental conditions around the Cooper Square substation.
Problem
Researchers were working across fragmented, inconsistently structured datasets with no way to compare them spatially or communicate findings clearly across teams. The deeper goal: make infrastructure systems — and how climate burdens distribute unevenly across communities — more legible to both researchers and, eventually, the public.
My Role
- • Shape the project's conceptual framing around local vs. systemic responses to environmental hazards
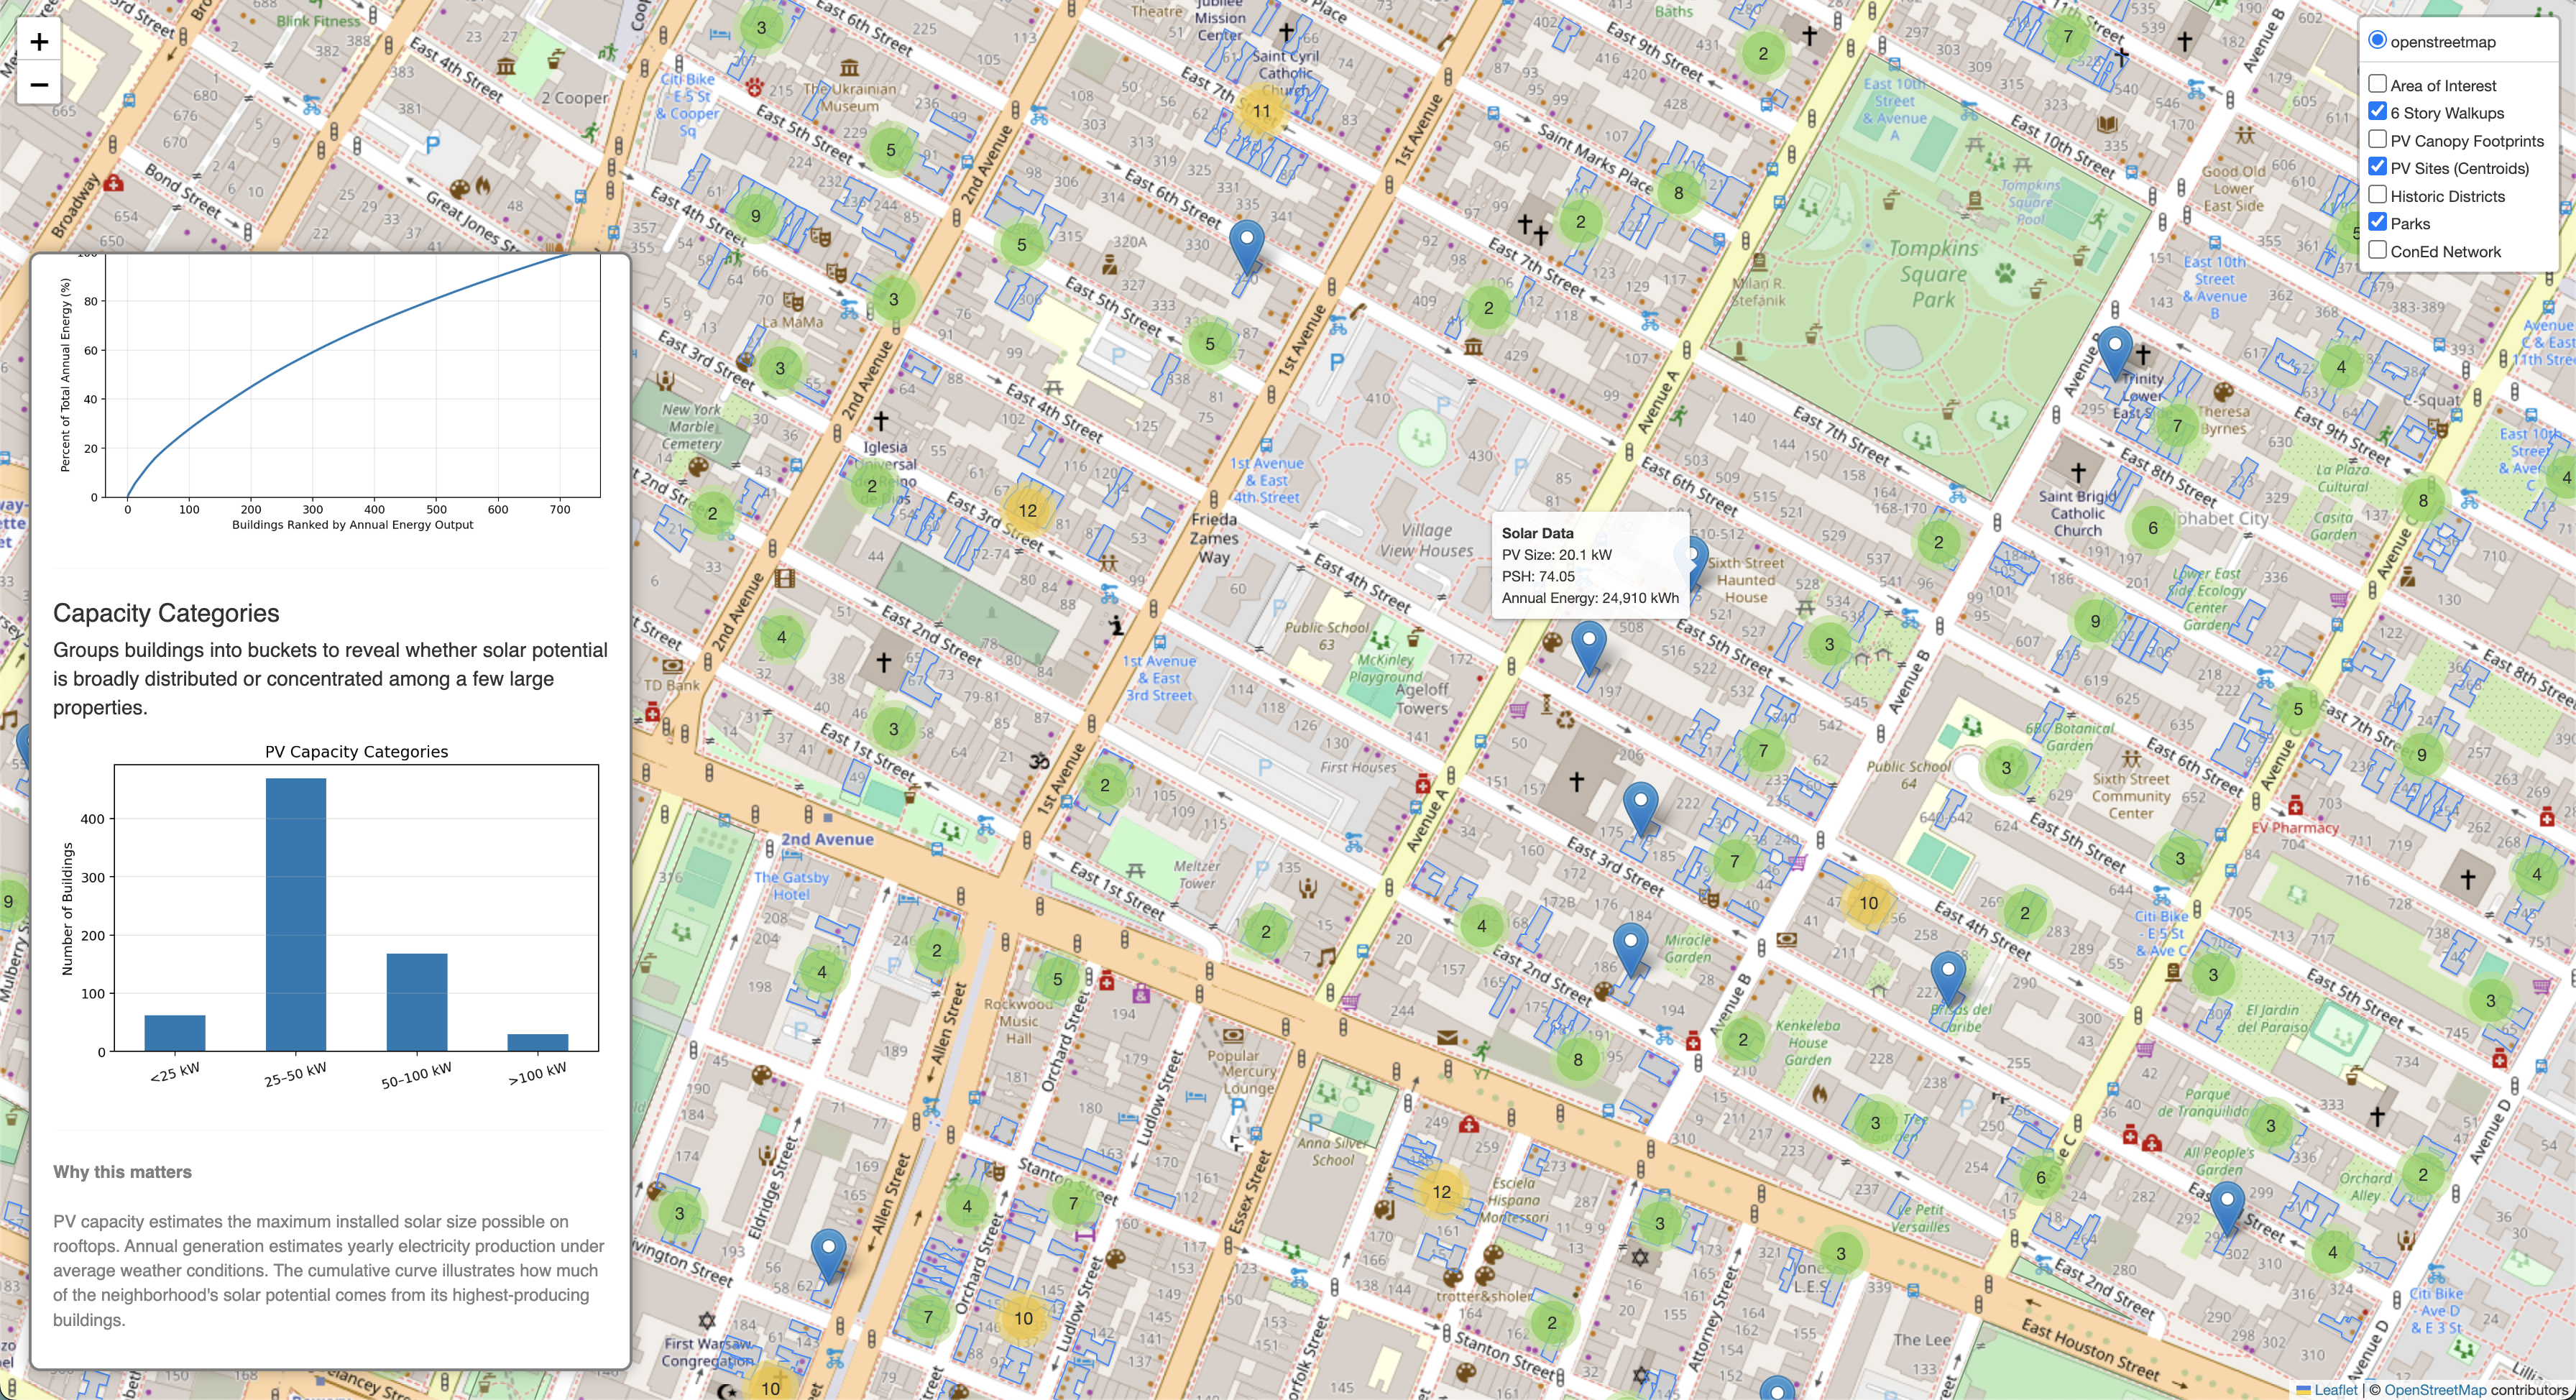
- • Design and build the spatial mapping tool, including information architecture and visualization strategy across datasets
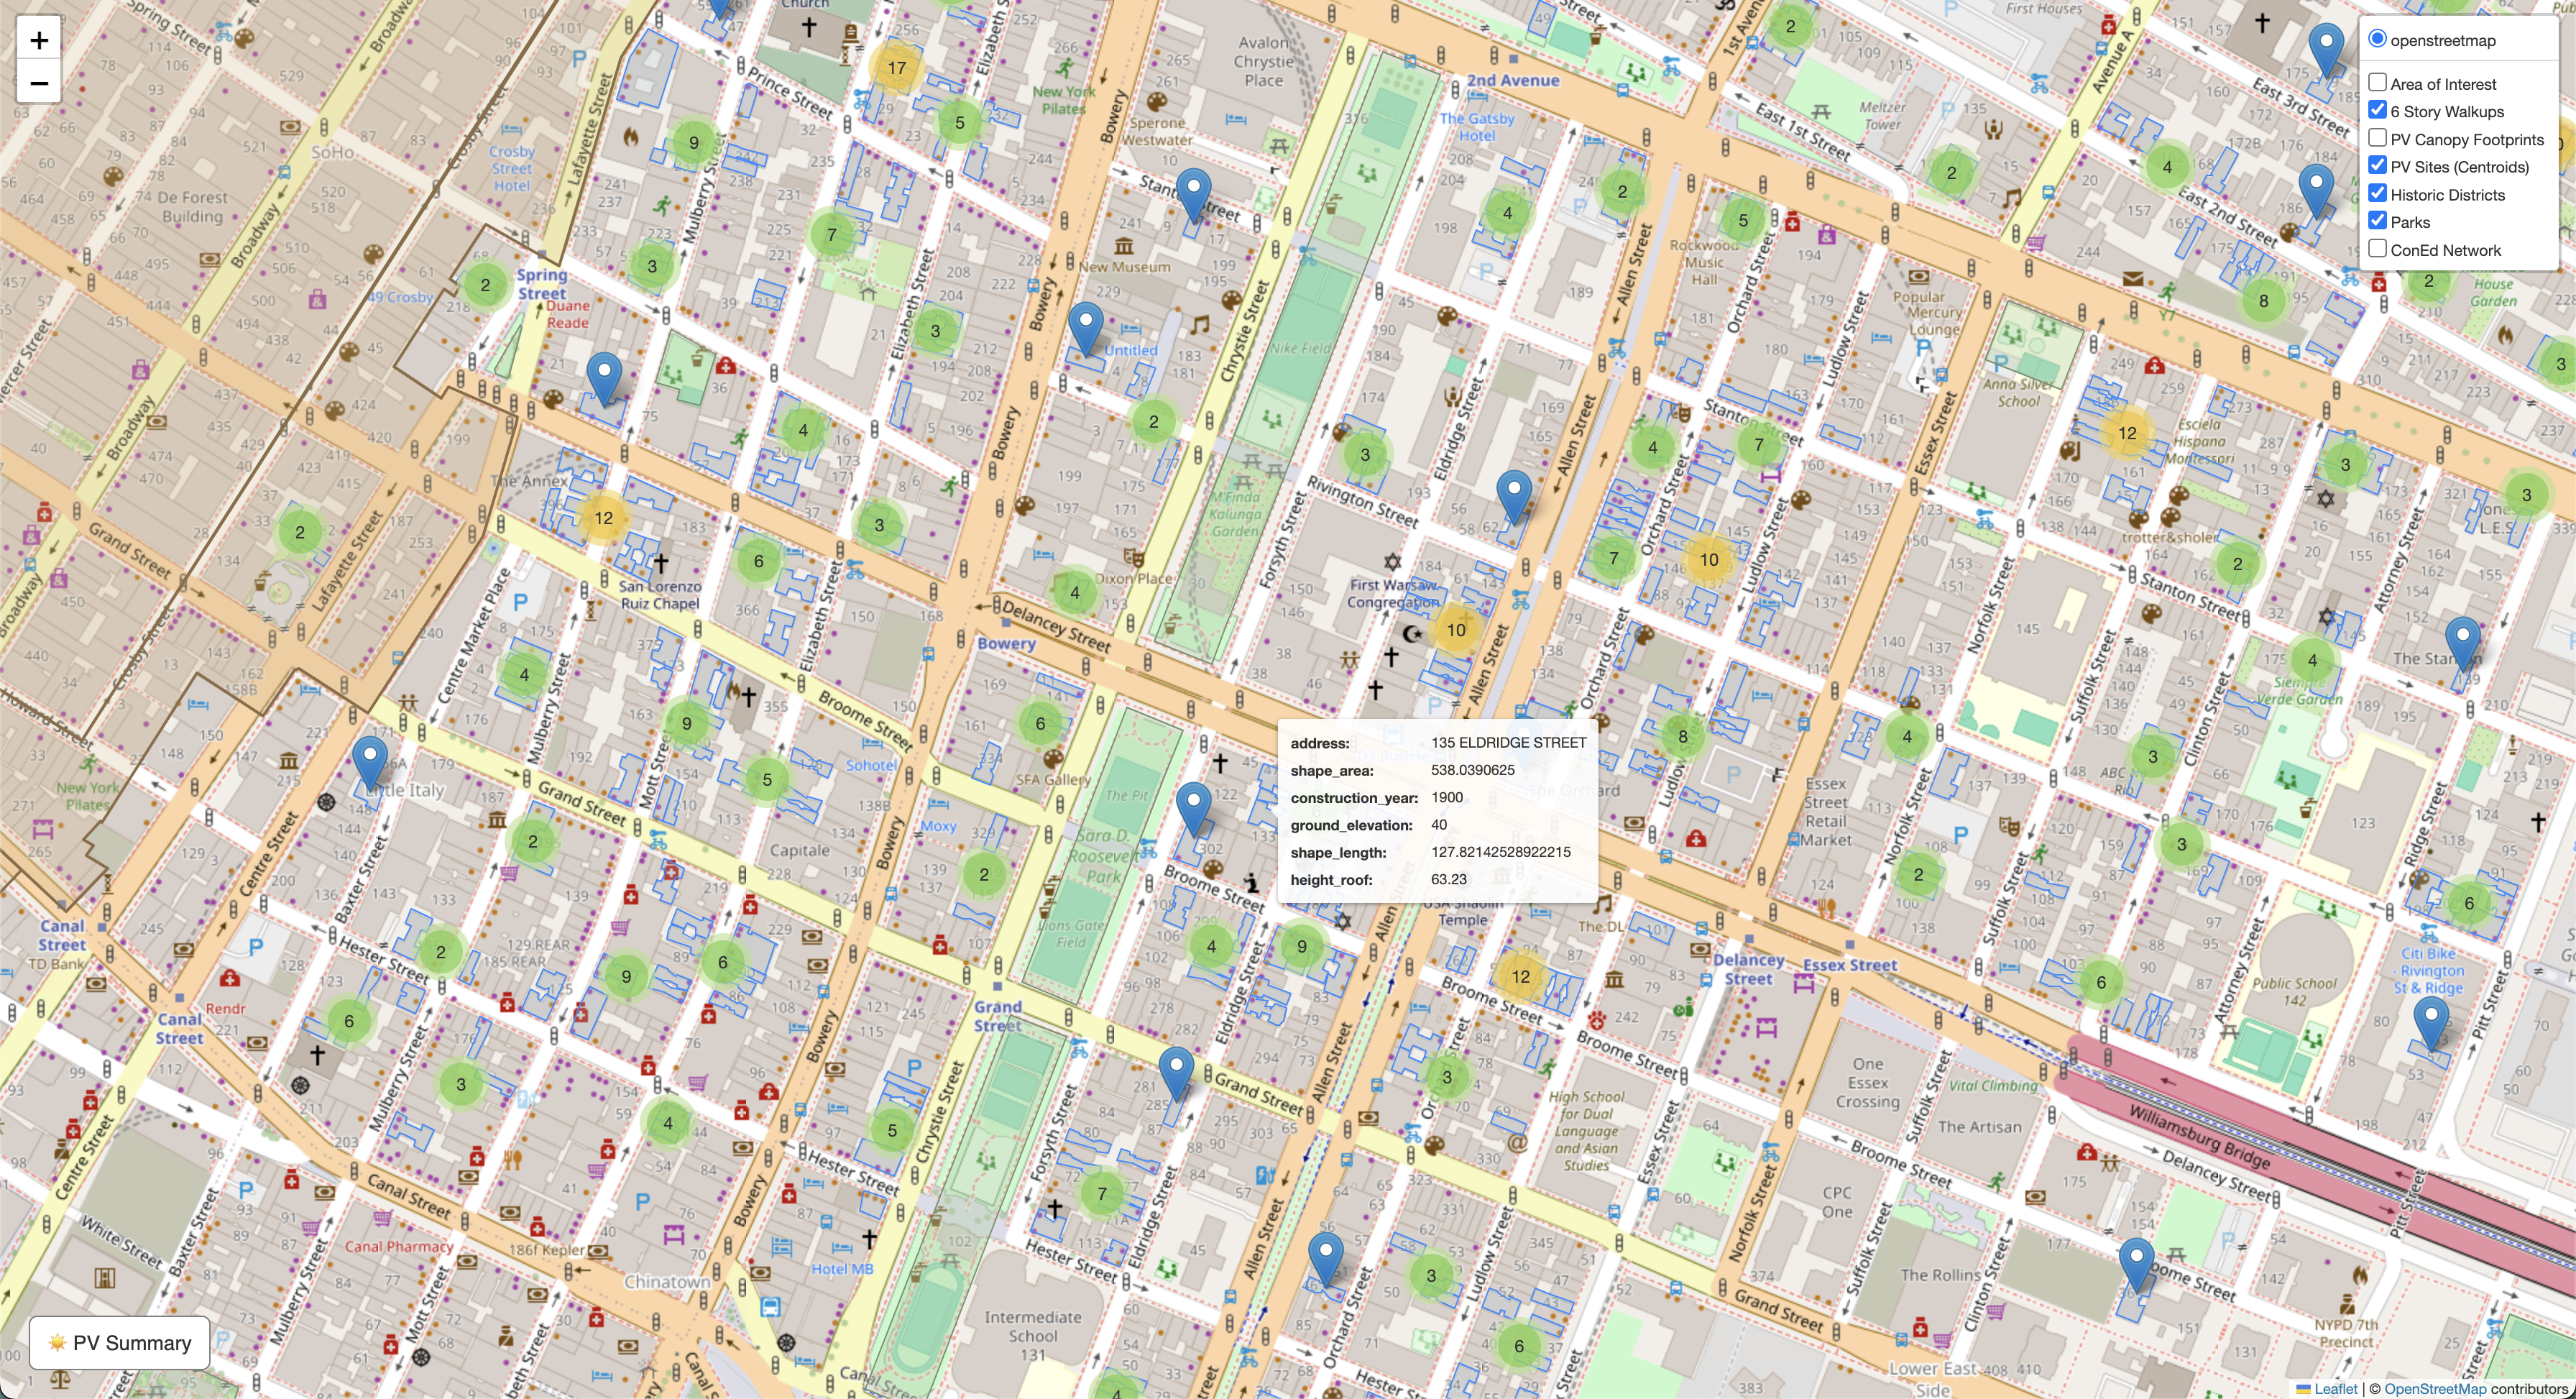
- • Integrate and process multiple NYC open datasets (MapPLUTO, building footprints, zoning layers, historic districts, Con Edison network data)
- • Build Python workflows to merge, clean, and structure datasets using shared geographic identifiers
- •Refactored and documented the codebase for maintainability and future development
- • Refactoring and documenting the codebase to improve maintainability and support future project development
Constraints
- • Fragmented, inconsistently structured open datasets from multiple sources
- • Designing legible interfaces for dense, technical data
- • Mapping framework limitations on tooltip hierarchy, styling, and interaction
- • Evolving requirements as research continues
- • Balancing large spatial datasets against browser performance
Design Decisions
- Layer-based exploration
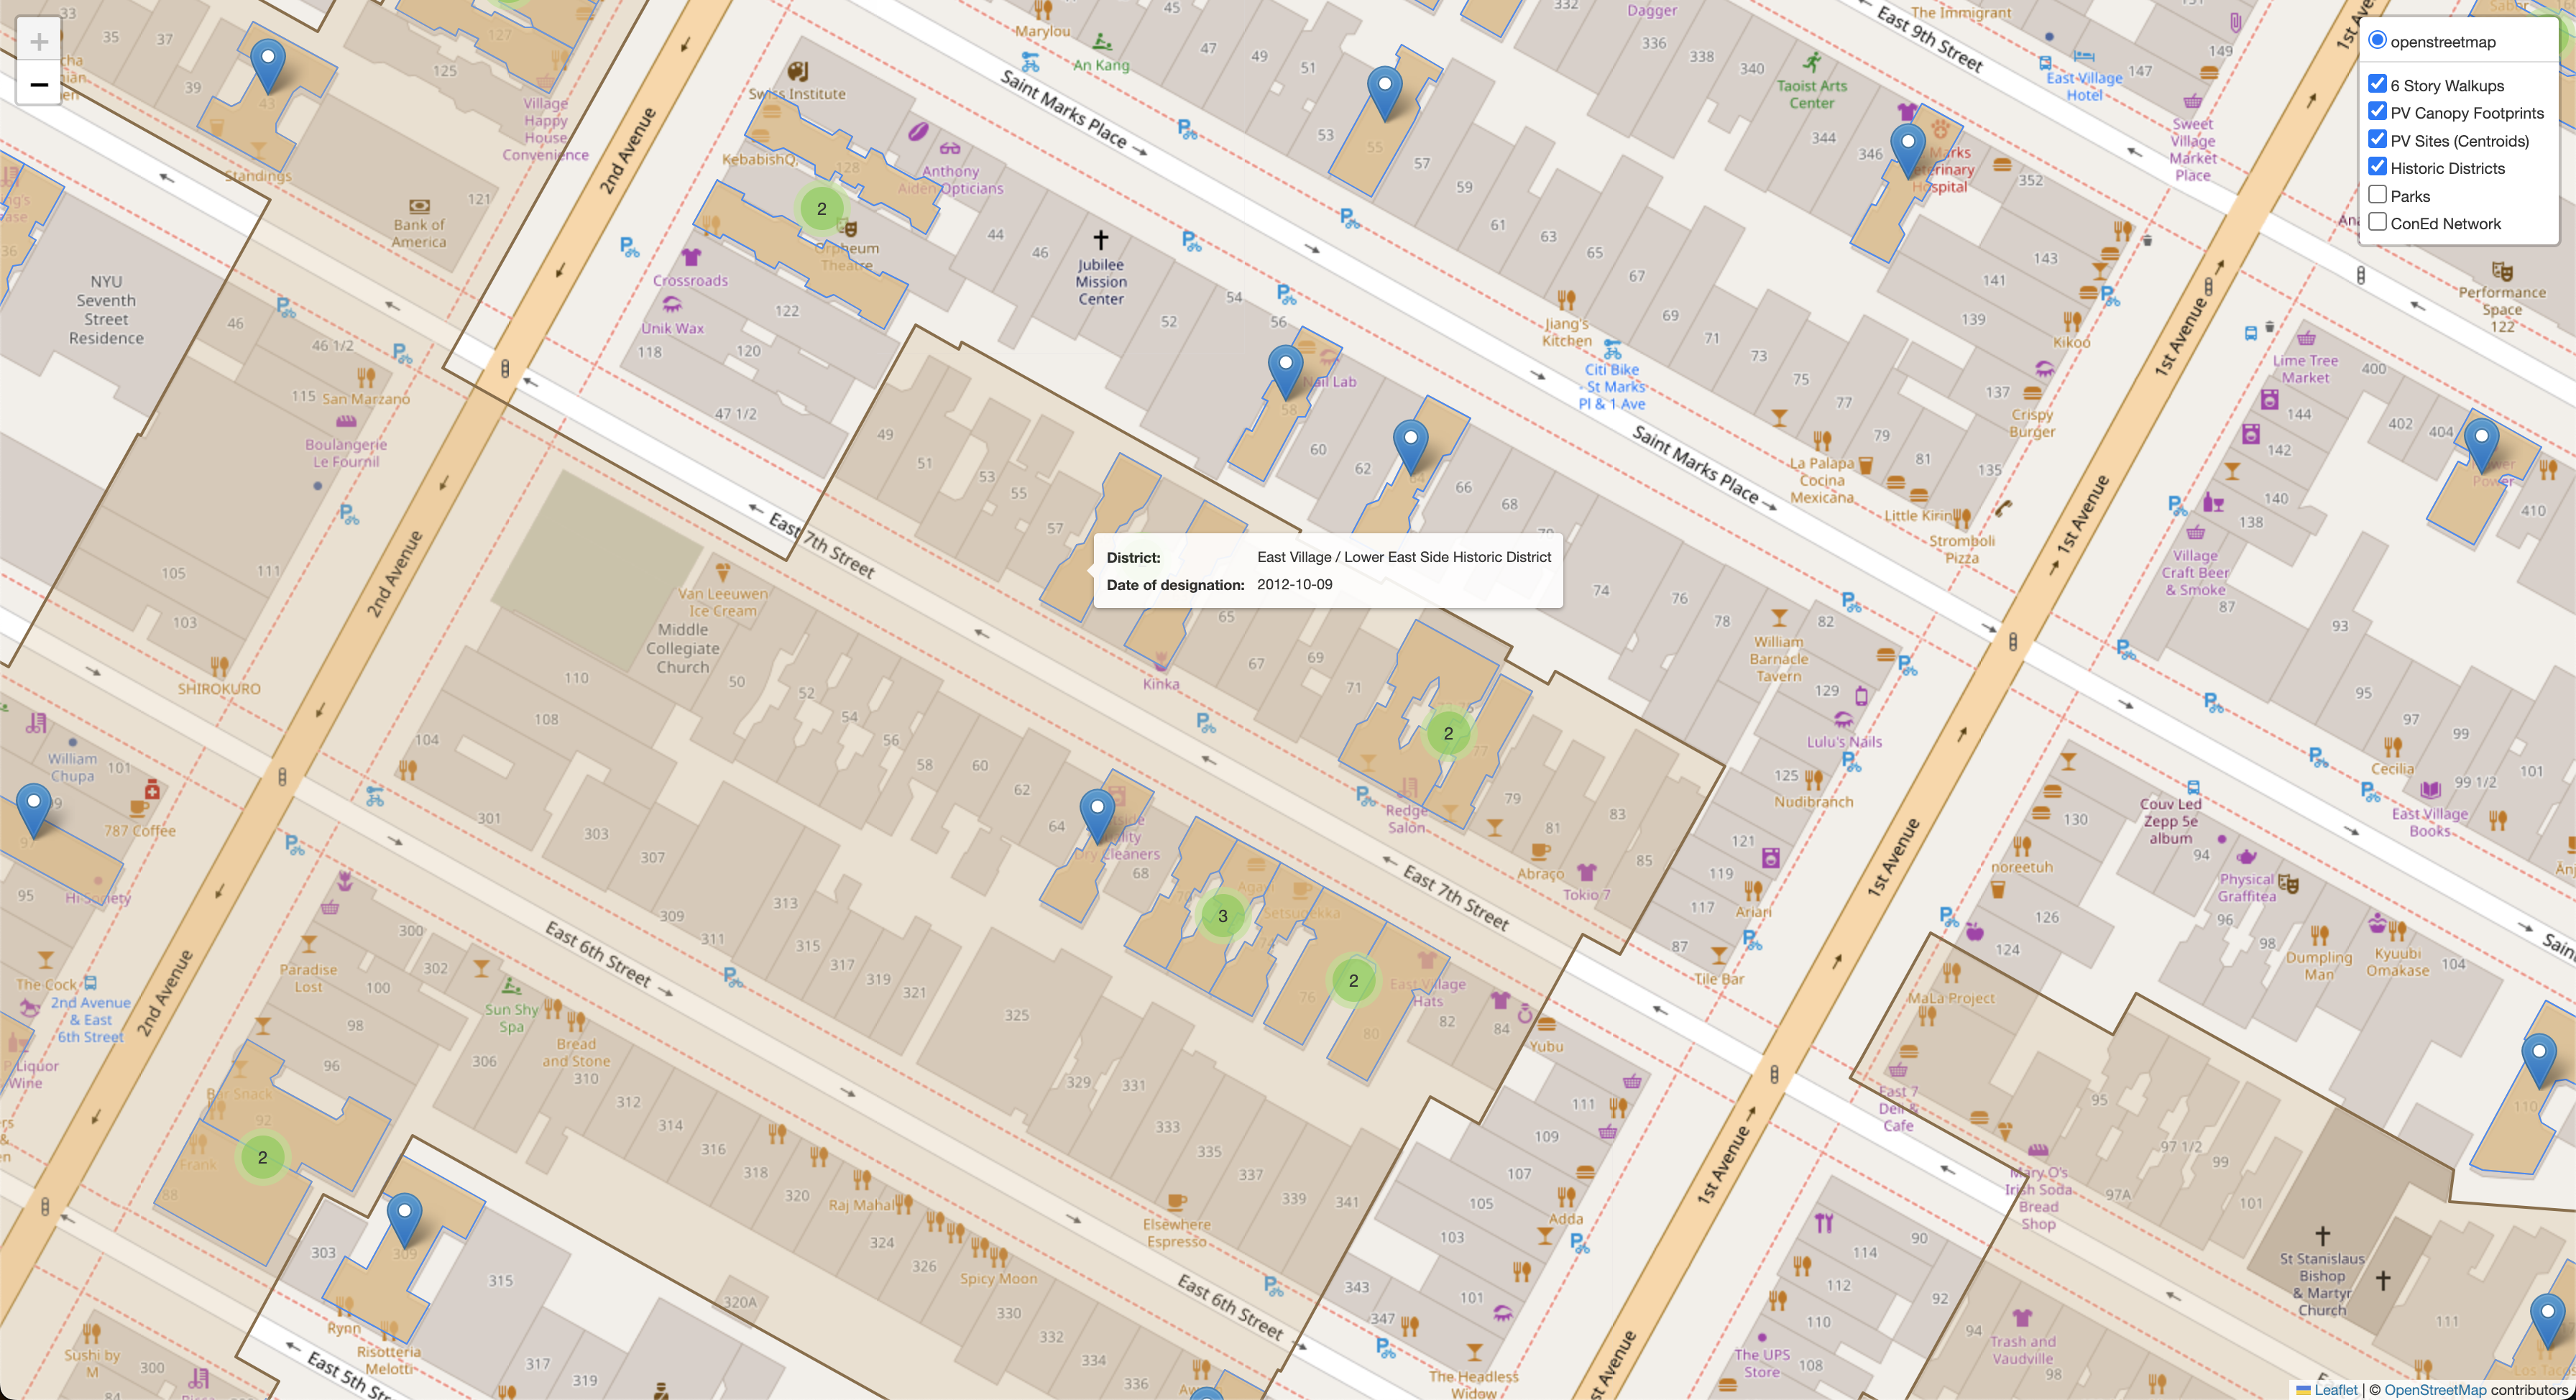
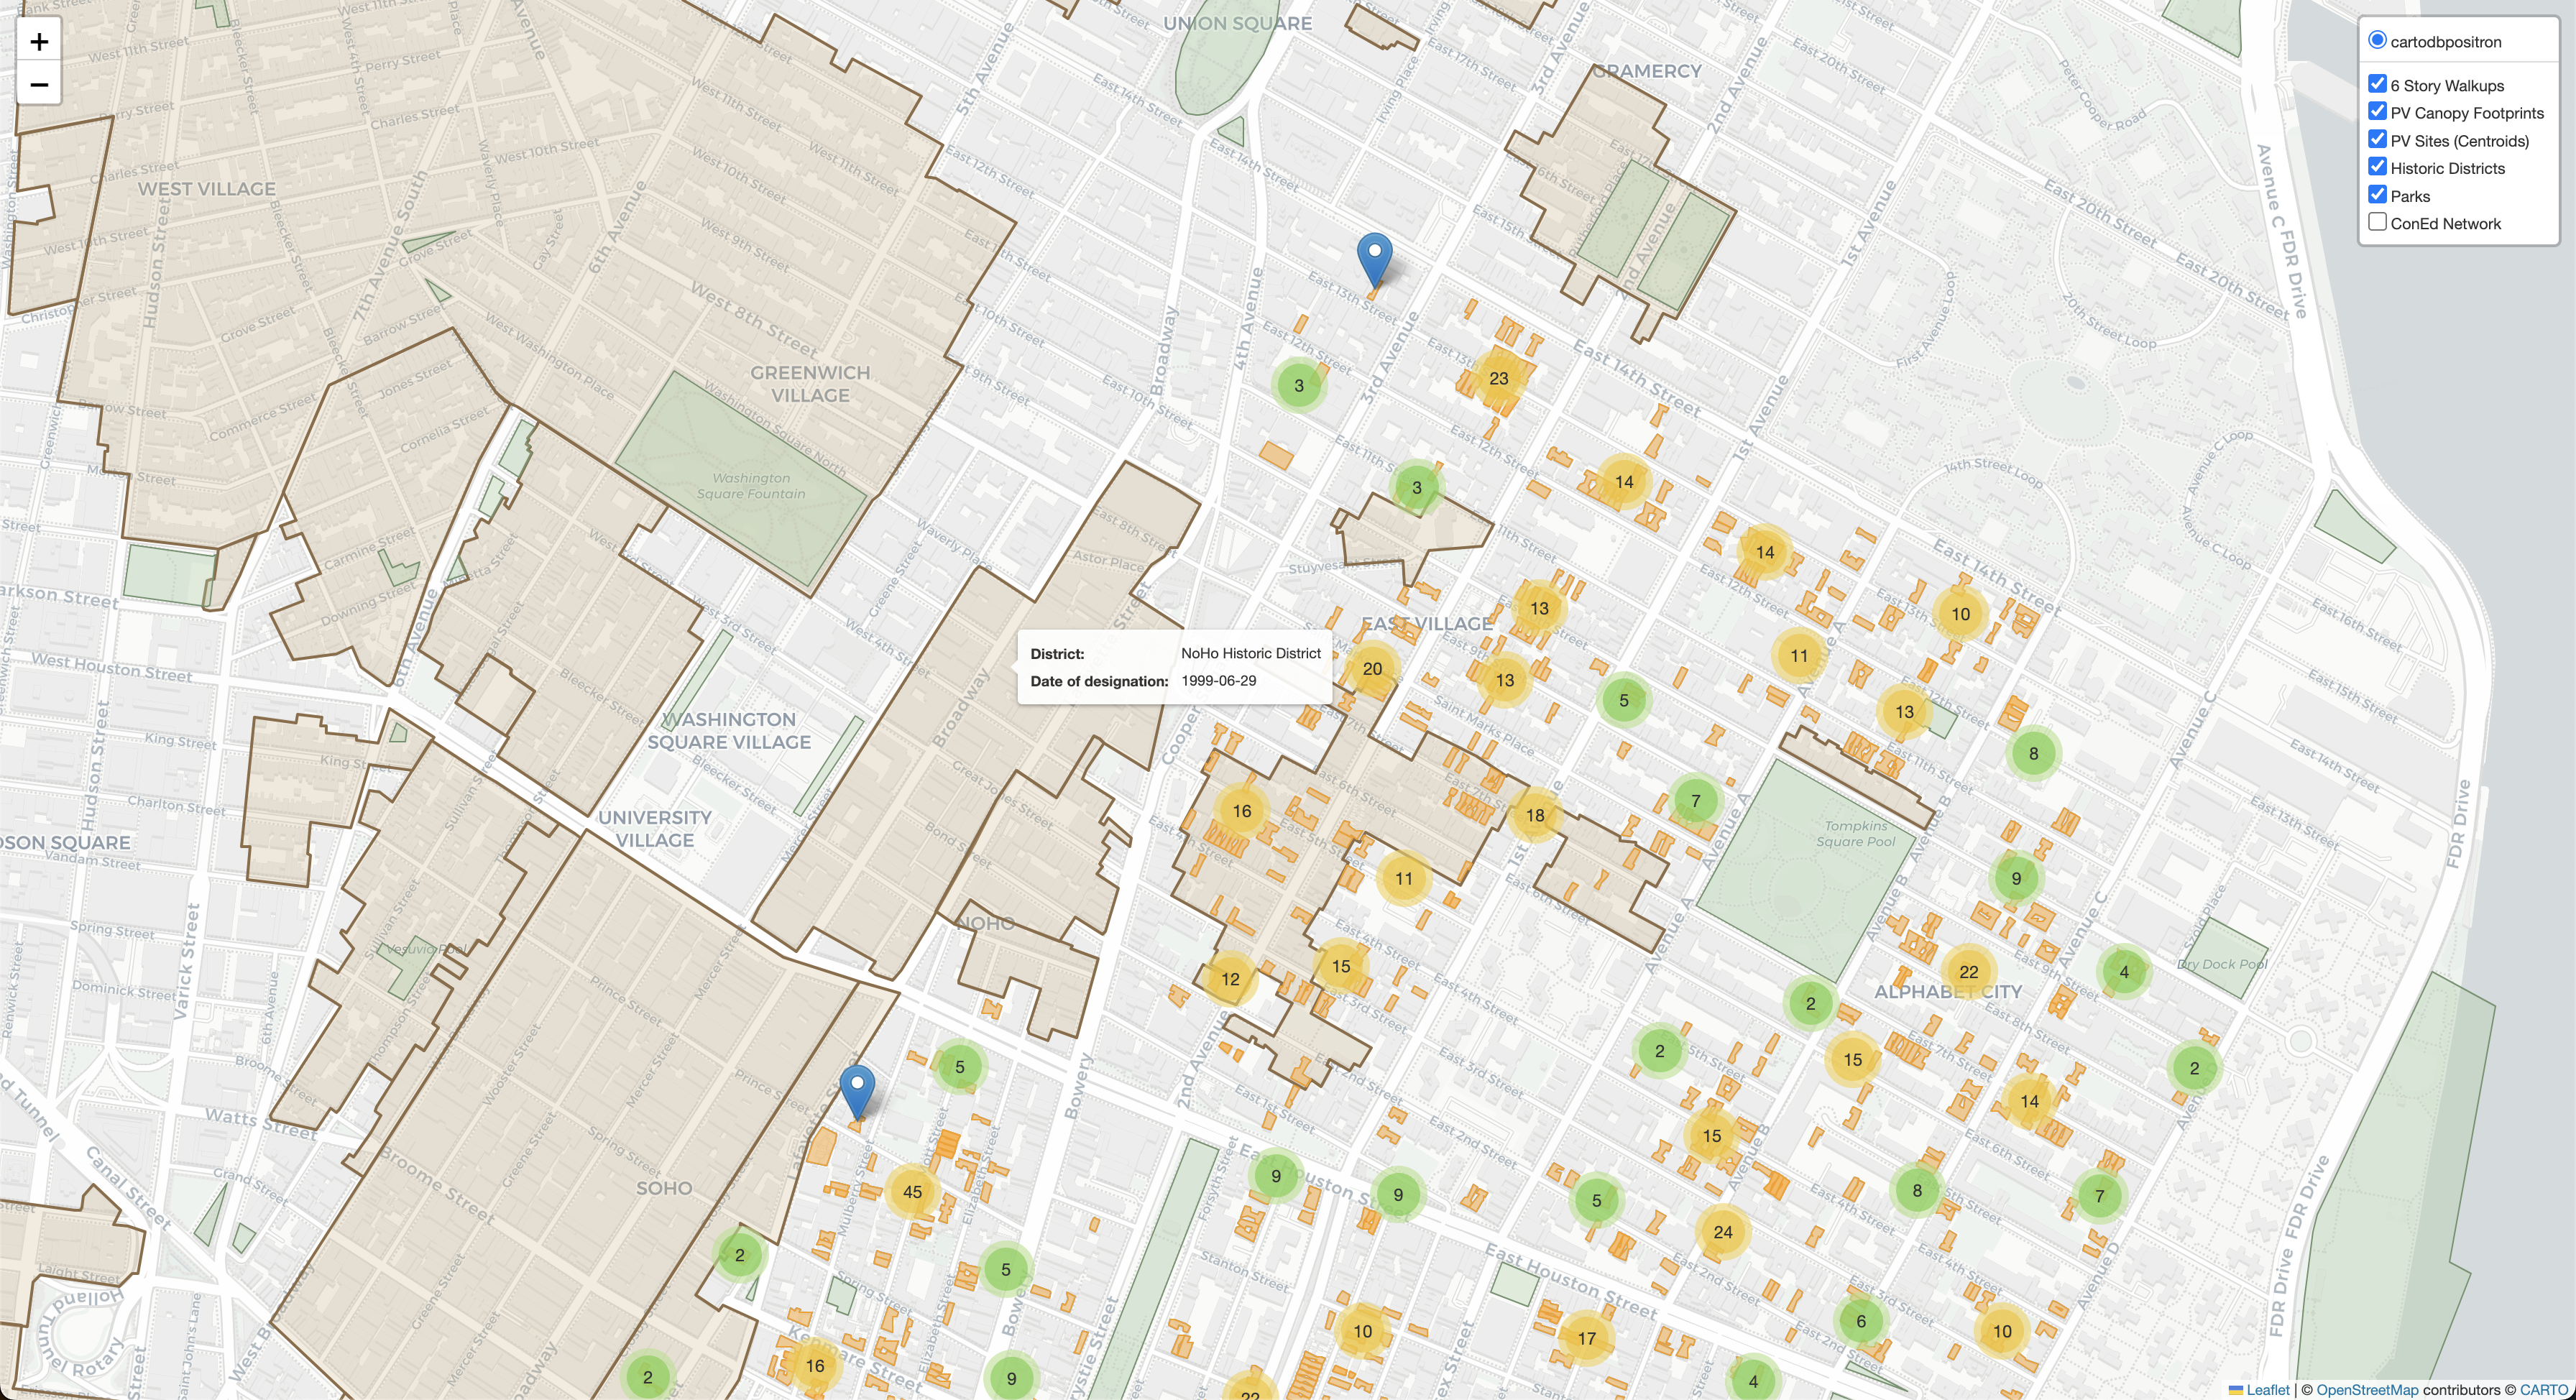
- Instead of fixed charts or static dashboards, I designed the interface around toggleable spatial layers, so researchers can compare systems dynamically and construct their own lines of inquiry.
- Modular data pipeline
- Each dataset is processed independently before merging, and geospatial layers stay separate from the larger building-level dataset. This keeps the system maintainable and lets new datasets get added without a rebuild.
- Designing separate interfaces for research and public engagement
- The current tool serves internal research. I'm exploring how a public-facing version would need different priorities — accessibility and narrative framing over raw exploratory depth.
Current Progress
In development as part of Ecolibrium's lab initiative. Current functionality: layered building footprints, solar potential analysis, zoning overlays, infrastructure mapping, Con Edison network data, and interactive building-level tooltips for exploratory analysis.